My goal is not only to become a successful trader, but to do it in a way that will lead me to a life of financial freedom and leave me with a clean conscience about how I got there. As we are all aware, there are those who we would agree are either pumpers, or just plain bad traders with a bunch of followers. You will not hear me publicly go after others or trash talk a stock often. Why?
Because it doesn't help us make money and it doesn't help us learn. That being said, let's get to some analysis. My goal is to help you LEARN and to help myself learn in the process. I am on your side and enjoy seeing the spark in all the new traders who follow me that I've met recently.
Let's get to work...
First, let's take a look at CHEK -- and in doing so, this brings up an interesting first little lesson for us.
So.....what do you see? No, that's not a trick question. You shouldn't really see much. We can certainly read all into it and give some BS analysis, but this chart is not helpful for our purposes.
MULTI-TIME FRAME ANALYSIS! If you are not familiar with this concept, you must spend the time to understand it. We must consider the time frame we are looking to trade when we choose time frames on our charts! This is a daily chart (each candle representing 1 day). Unless we want to long-term swing this, I need to see a shorter timeframe. Now we have....
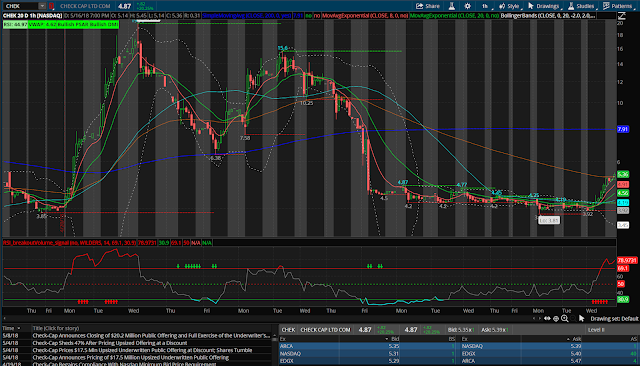
Ahh, damn. Now THAT is nice!!! Shorts are about to lose their faces and we should short squeeze real nice tomorrow. There's a lot I could teach based on this chart alone, but until I have some idea for whether anyone is even interested in reading or not....let's keep it to the point.
I see:
- Chart beginning to move back up
- No this isn't a guessing game -- what do we look for guys? BREAKS OF RESISTANCE!
- We broke above the resistance levels you see on the chart at $4.77 and $4.87 -- that was our first possible entry point!! At the breakout!
- Level 2 price strong above close price
- This is a strong indication that we will have a huge day tomorrow and continue running up. But....WE MUST ACCOUNT FOR THE RISK OF THE PLAY!
- The stock closed up 20% on the day, and the price is up even more in after hours...this is no fire sale bargain!! Play smart!
- Big red gap candle that leads us up to $6.38 -- where is this?? Let me actually point out all these levels to you that I just mentioned then I'll finish up.....
That all making sense?
If so, we have settled the play in our mind -- we are bullish. This should squeeze. Let's finish with some PTs, entries, and what to look for... *reminder to myself and yourself to TRADE THE PLAN, too often we throw all our analysis out the window and lose money! No more. *
- Huge level is going to be $5 psychological support level.
- Closing price was below this and the bulls won in the after-hours, but we must watch in PREMARKET. It gets really frustrating when new traders ask the day before: what will happen? What will happen? How should I know dude? If someone wants to sell a huge amount of shares, our analysis will not tell the whole story.
- My eye is on PT $6.38
- That means I would sell/scale out of my position as we approach those levels, based on probability we get beaten down from that level.
- Conversely, if we BREAK $6.38, then it's just the opposite of what it says on the chart....
- ON A BREAKOUT: old RESISTANCE is new SUPPORT
- ON A DUMP: old SUPPORT is new RESISTANCE
That was a lot to say a little, but there is a lot of valuable information that I was never offered when I was a beginner trader trying to soak up information from those I wished to learn from.
Let's get this money!!!

No comments:
Post a Comment